Nvidia CEO Jensen Huang said last week that AI is "creating an enormous number of jobs." He's right — and one of the fastest-growing roles is the AI agent operations engineer. The job title didn't exist two years ago. Now it's appearing in job postings across every major tech company.
The work involves solving a new class of engineering problem: how do you observe, debug, and optimize a system where the logic lives inside an LLM?
Traditional APM tools weren't built for this. They assume deterministic code paths. Agents are neither deterministic nor fully predictable — and the failure modes are qualitatively different.
Why Agentic Observability Is Different
A standard microservice fails visibly: it returns an error code, throws an exception, or crashes. An agent fails silently and probabilistically: it completes a task but does it wrong. It takes the wrong approach, uses the wrong tool, reaches a confident-but-incorrect conclusion.
The debugging surface area is massive:
- LLM reasoning: invisible, non-deterministic, hard to reconstruct
- Tool call chains: complex, branching, state-dependent
- Memory state: accumulates over time, grows stale or contradictory
- Multi-turn behavior: emergent properties that don't appear in single-turn tests
- Cost accumulation: token spend is non-obvious until the bill arrives
Agentic observability requires three distinct layers, each with its own instrumentation strategy.
Layer 1: Distributed Tracing
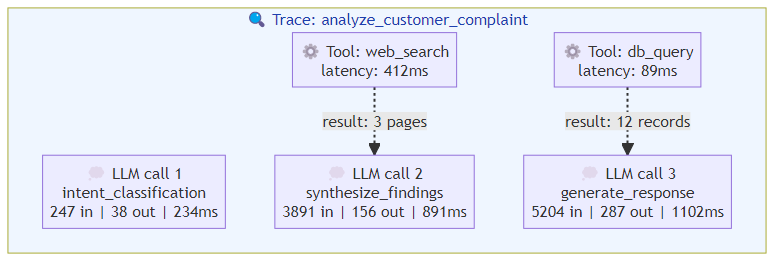
Every LLM call and every tool execution should produce a trace span, nested hierarchically so you can see the full execution tree for any conversation.
A complete trace for a single agent task looks like this:
Trace: analyze_customer_complaint (span_id: root)
├── llm.call.1 (span: intent_classification)
│   └── input_tokens: 1,247 | output_tokens: 38 | latency: 234ms
├── tool_call.1 (span: web_search)
│   └── args: {query: "company complaint policy"} | latency: 412ms
│   └── result: 3 pages retrieved
├── llm.call.2 (span: synthesize_findings)
│   └── input_tokens: 3,891 | output_tokens: 156 | latency: 891ms
├── tool_call.2 (span: db_query)
│   └── args: {table: "customer_history", id: "X"} | latency: 89ms
│   └── result: 12 records returned
├── llm.call.3 (span: generate_response)
│   └── input_tokens: 5,204 | output_tokens: 287 | latency: 1,102ms
└── total: 5 spans | total_cost: $0.014 | total_latency: 2,728ms
The critical signals in a trace:
- Span depth: excessive nesting suggests the agent is looping or over-planning
- Tool call ratio: too many tool calls → the agent is trying to brute-force through the task
- LLM call density: high density with low tool usage → the agent is reasoning without acting
- Token burn rate: cost accumulation over the conversation
Trace Architecture
For multi-agent systems, trace context must propagate across agent boundaries. Use a correlation ID that travels with the request through every agent, so you can reconstruct the full cross-agent execution tree.
User Request → Agent A (trace: parent)
  → LLM call A1
  → Tool call A1
  → Handoff to Agent B (correlation_id: parent.id)
    → LLM call B1
    → Tool call B1
    → Handoff to Agent C (correlation_id: parent.id)
      → LLM call C1
Without cross-agent tracing, you're flying blind when an agent fails and the failure cascades.
Layer 2: Behavioral Metrics
Standard APM metrics (CPU, memory, request latency) don't capture what matters for agents. You need agent-specific metrics:
Task Completion Metrics
Success rate: the percentage of tasks that achieve their goal, defined by task type. Not a single metric — broken down by intent category, tool used, and session length. An agent might have 95% success on "lookup" tasks but 72% on "complex reasoning" tasks.
Task completion time: measured from request receipt to final response, broken down by task type. Useful for identifying which task patterns are slow.
Tool call efficiency: ratio of successful tool calls to total tool calls. A low ratio indicates the agent is trying the wrong tools or making incorrect arguments.
Error classification: categorize failures by type:
- Tool failures (timeout, API errors, invalid arguments)
- Reasoning failures (wrong approach, missed constraints)
- State failures (inconsistent context, memory corruption)
- Escalation rate (when the agent gives up and hands to human)
Cost Metrics
Token cost per task is non-obvious because cost accumulates invisibly through the conversation. Track:
- Input token burn: grows with conversation length, context loading
- Output token burn: grows with verbosity, retries, and over-generation
- Tool call cost: some tools (web search, code execution) are expensive
- Cost per successful task: the metric that ties cost to value
This matters operationally: an agent that achieves 95% success but costs $0.50 per task may be worse than one that achieves 88% success at $0.08 per task.
Session Metrics
Conversation length distribution: what percentage of sessions reach 50, 100, 200 messages? Long conversations are where agents drift — track the metrics specifically for long sessions.
Memory growth rate: how fast does episodic memory grow per conversation? If memory grows unboundedly, retrieval degrades.
Context window utilization: what percentage of the context window is actually used vs. wasted? High utilization at low performance = noisy context.
Layer 3: Behavioral Anomaly Detection
The hardest observability problem: detecting when the agent's behavior changes in ways that aren't captured by success rate alone.
Agents can exhibit:
- Tone drift: becoming more aggressive, apologetic, or verbose over time (sign of context contamination or alignment drift)
- Confidence calibration failure: the agent expresses high confidence in wrong answers (sign of knowledge gaps or outdated context)
- Tool preference drift: the agent starts using different tools for the same task type (sign of prompt drift or model update effects)
- Loop behavior: repeating the same sequence of tool calls (sign of state corruption or context confusion)
Detection approaches:
Behavioral baselines: profile the agent's behavior on a reference task set. Establish baseline metrics for tool call patterns, reasoning depth, and output characteristics. Monitor for statistically significant deviations.
Output quality sampling: don't just monitor if the agent succeeded — periodically sample outputs and evaluate them manually. This catches the failures where the agent confidently produces wrong-but-plausible content.
Contradiction detection: compare agent outputs against stored knowledge. When the agent says something that contradicts what it should know (based on retrieved documents or learned facts), flag for review.
The Observability Stack in Practice
The full observability stack for a production agentic system:
Trace collection: OpenTelemetry instrumentation on every LLM call and tool execution. Propagate trace context across agent boundaries.
Metrics aggregation: Prometheus + Grafana for agent-specific metrics (success rate, cost per task, token burn rate, tool call efficiency). Alert on threshold violations.
Log enrichment: structured JSON logs with trace IDs, session IDs, tool call metadata. Enable correlation between traces and logs.
Behavioral monitoring: periodic sampling of agent outputs for quality evaluation. Statistical process control on behavioral baselines.
Session replay: full session state capture for post-mortem analysis. Store the complete context window, all tool outputs, and the final response — not just the result.
Without session replay, debugging is guesswork. With it, you can reconstruct exactly what happened and why.
The Bottom Line
Agentic observability isn't an extension of traditional APM — it's a different discipline. The signals that matter (reasoning quality, tool call efficiency, memory state, cost per task) aren't captured by standard tools.
Build observability into the agent harness from the beginning. Instrument every LLM call, every tool execution, every memory operation. Establish behavioral baselines. Monitor for drift.
The agents that fail in production aren't the ones that crash — they're the ones that quietly become less reliable, more expensive, or more confidently wrong. Observability is how you catch them before your users do.
Related posts: Real-Time AI Agent Inference — latency and throughput optimization for agentic systems. Scaling AI Agents — infrastructure patterns for production agentic systems. AI Agent Evaluation Framework — measuring agent quality and reliability.